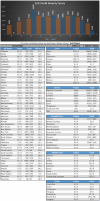
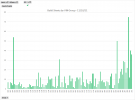
I post a very similar chart to this daily on the TRX forums, but it is TRX specific. I have for the time being replaced the options section with the series in the hopes this is interesting to anyone here.
The WS to LOT for all the US states is the average transit time to each state based on roughly 17000 trucks that I have tracked from the time they got a window sticker until they are reported delivered to the lot so it should be a decent estimation of the average wait time once you have a window sticker. Obviously larger states vary based on the side of the state closest/furthest from Sterling Heights, etc. but its the best I can offer on a high level.
Every other column is the number of trucks built (BS) / Finished (WS) Then separated into Todays numbers and the totals since the start of 2022.
View attachment 110713


