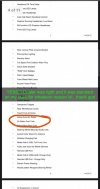
I couldn't find it on this thread but can someone explain to my feeble brain this tracking log?
The top one is easy - built/shipped per week
The second one is where I'm asking for clarification
- first column is trucks with Build Sheets vs. Window Stickers as of Today - in this case 4/29 - is that correct?
- then a total of that same thing
- 3rd column is WS to Shipped that day?
I gather a TON of information daily and this is my best attempt at cramming as much as possible into a single image each day.
So total trucks built today is 1144 with 0 finished (window stickers get reported in the evening so I update the chart again with the numbers shipped for the day).
Everything below that includes trucks built (BS) and trucks finished (WS) and is a break down of the total for today and also the totals for the year.
So for example, I will pick Colorado.
Of the 1144 trucks built today, 27 of are destined for Colorado, 3789 of all trucks (208075) have been built for Colorado and 3700 of those have shipped.
The WS to Lot is the average transit from when a truck was finished at the factory until it hit the dealers lots for each state. I currently calculate a 60 and 30 day average to help show if things are improving or lagging, so right now Colorado had a 60 day average of 24 days and a 30 day average of 25 days so things are slowing just slightly.
Same goes for any other section, you want to know how many of the 1144 trucks built today were Black? (220), Want to know how many were Limited's, 155, and of those 32 were 10th anniversary editions.
I hope that clears things up a little, but if you have any questions please let me know!
And a couple weeks late, but welcome to the forums!


