I just checked my signed contract and it states that "this agreement is the final contract price to which you and I have agreed, and, if the vehicle is a new motor vehicle, no additional fee or charge will be imposed or collected due to changes in the manufacturers list price, or changes in the cost of freight or services provided by you. Based on this I don't expect the price of my truck to change based on the cost increase.
5thGenRams Forums
You are using an out of date browser. It may not display this or other websites correctly.
You should upgrade or use an alternative browser.
You should upgrade or use an alternative browser.
Start of 2022 Production.
- Thread starter triple_B
- Start date
t_henrickson
Active Member
- Joined
- Nov 1, 2021
- Messages
- 94
- Reaction score
- 96
- Points
- 18
- Age
- 35
Another classic case of who to believe here....Ram chat told me I'm in the trim stage, the Ram chat phone number told me it's in scheduling waiting on parts. My POC has a ship date of 12/14 with a D1 which I know is not accurate but it would make more sense for it to actually be in trim stage or "G". Was there ever a consensus on which contact method to trust more? And I say "trust" very hesitantly.
MojitoJLUR
Active Member
- Joined
- Jul 26, 2021
- Messages
- 77
- Reaction score
- 105
- Points
- 33
- Age
- 47
You know who was right depending on if you have a build sheet tomorrow or not.Another classic case of who to believe here....Ram chat told me I'm in the trim stage, the Ram chat phone number told me it's in scheduling waiting on parts. My POC has a ship date of 12/14 with a D1 which I know is not accurate but it would make more sense for it to actually be in trim stage or "G". Was there ever a consensus on which contact method to trust more? And I say "trust" very hesitantly.
- Joined
- Jun 8, 2021
- Messages
- 5,465
- Solutions
- 1
- Reaction score
- 10,469
- Points
- 113
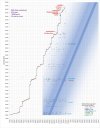
I'm putting the chart in here again, so you don't have to look back to cross-reference.Sorry as I am new here but I am just curious as to what this graph represents?
- The squiggly line on the left represents the timeline of actual orders (VIN assignments). Ordering opened on 5/6/21 and VINs started at 100001. That's the bottom left of the chart. As time has gone by (X axis) the VINs have gone up (Y axis).
- The thin blue line in the middle represents the "theoretical" date that your truck should have been built, based on the assumptions listed (9/13 start of production, 6000 trucks/week), and also assumes that everything is built sequentially by VIN. Obviously, those are huge assumptions, but it was a starting point.
- The thick blue band represents the theoretical delivery date (3-4 weeks after the theoretical build sheet date).
- All of the dots represent "actual" build dates for each VIN.
If your dot ends up being to the left of the thin blue line, then you're fortunate (or bribed Ram, as @monkeypunch so eloquently said).
If your dot ends up being to the right of the thin blue line, then you're getting "screwed".
truckless
Well-Known Member
Just talked to my salesman on the window sticker price difference. Won’t know what the actual invoice price is until tomorrow, but he says that he just did a deal on a 392 Rubicon that had the same issue. Window sticker was higher than the POC and when they got the invoice it was at the original POC price. So I’m crossing my fingers that this Window Sticker is just bad information. Gotta love this Ram roller coaster. What a clusterf***.
Dammit, still doesn’t work for me.
clusterfuckfuckityfuckfuckfuck
truckless
Well-Known Member
How many of us have had to order multiple times to finally get their build complete?
I just placed a second order myself. Took one for a test drive and actually kinda like the etorque...never actually felt a truck shift so smooth. So I had a second order placed identical but with etorque....dealer principle said "in all honesty, that one might actually get built first".
Interestingly though side by side, there is a price discrepency between the two on the Limited 1 group....by about $1500 (Canadian). That SAME discrepency appeared before on my first POC a couple times where the price went down and back up but it appears fresh on this new one.
Randboye
Active Member
For those that got their POC
did you get the one that shows
HB holdback price
FFP friends and Family price
EP Employee Pricing
If so how much off your MSRP or Invoice price does it show and did anybody get the Hold Back price off on their deal?
My understanding is hold back price is to help dealers compensate for how long vehicle sets on their lot. Since were all ordering, should not be anytime the trucks are setting on their lot, so that's extra income for the dealer
Someone may have a better understanding.
monkeypunch
Well-Known Member
- Joined
- May 9, 2021
- Messages
- 426
- Reaction score
- 551
- Points
- 93
- Age
- 39
Hold back is money the dealer receives for selling the vehicle. Basically a way to raise invoice, but the dealer is making more than before. How many times have you been car shopping and had the sales guy show you the invoice, and say "I'll sell it to you at only $500 above this, we are making almost no money!!"For those that got their POC
did you get the one that shows
HB holdback price
FFP friends and Family price
EP Employee Pricing
If so how much off your MSRP or Invoice price does it show and did anybody get the Hold Back price off on their deal?
My understanding is hold back price is to help dealers compensate for how long vehicle sets on their lot. Since were all ordering, should not be anytime the trucks setting on their lot, so that's extra income for the dealer
Someone may have a better understanding.
t_henrickson
Active Member
- Joined
- Nov 1, 2021
- Messages
- 94
- Reaction score
- 96
- Points
- 18
- Age
- 35
Very true. My dealer confirmed my POC showed G status so I guess the chat was potentially right. Still not believing anything until it's in my driveway though hahaYou know who was right depending on if you have a build sheet tomorrow or not.
so far every deal so far 10 of them now with my dealer has been invoice less half the holdback. He did tell me this time the owner was questioning him on this deal and he had to remind him of my buying power so far.Hope he is still working there when I am looking again.Hold back is money the dealer receives for selling the vehicle. Basically a way to raise invoice, but the dealer is making more than before. How many times have you been car shopping and had the sales guy show you the invoice, and say "I'll sell it to you at only $500 above this, we are making almost no money!!"
MojitoJLUR
Active Member
- Joined
- Jul 26, 2021
- Messages
- 77
- Reaction score
- 105
- Points
- 33
- Age
- 47
For those that got their POC
did you get the one that shows
HB holdback price
FFP friends and Family price
EP Employee Pricing
If so how much off your MSRP or Invoice price does it show and did anybody get the Hold Back price off on their deal?
My understanding is hold back price is to help dealers compensate for how long vehicle sets on their lot. Since were all ordering, should not be anytime the trucks are setting on their lot, so that's extra income for the dealer
Someone may have a better understanding.

bigdodge
Happy Ram Owner
- Joined
- Aug 25, 2021
- Messages
- 4,560
- Reaction score
- 2,881
- Points
- 113
- Location
- southwest. where majority rules
Last edited:
myownstatus
Active Member
- Joined
- Nov 1, 2021
- Messages
- 162
- Reaction score
- 142
- Points
- 43
- Age
- 40
For those of you wanting to see how a dealers tracks the trucks and when a finished truck leaves the plant
My trucks window sticker was posted Dec 3rd and you can see on the bottom of the picture it shipped on dec 4th. it is currently outside of Belen New Mexico which is the union pacific railroad line
View attachment 113860
Is the dealer providing this screen image?
Sent from my iPhone using Tapatalk
- Joined
- Jun 8, 2021
- Messages
- 5,465
- Solutions
- 1
- Reaction score
- 10,469
- Points
- 113
Why does it say "vehicle damaged" in there?For those of you wanting to see how a dealers tracks the trucks and when a finished truck leaves the plant
My trucks window sticker was posted Dec 3rd and you can see on the bottom of the picture it shipped on dec 4th. it is currently outside of Belen New Mexico which is the union pacific railroad line
View attachment 113860
arod412
Ram Guru
So essentially, dealers are bullsh!tting us, when they say "they don't know"For those of you wanting to see how a dealers tracks the trucks and when a finished truck leaves the plant
My trucks window sticker was posted Dec 3rd and you can see on the bottom of the picture it shipped on dec 4th. it is currently outside of Belen New Mexico which is the union pacific railroad line
View attachment 113860
2021 Ram Rebel
2016 Dodge Charger scat pack
2021 Jeep Wrangler Unlimited Sahara
- Joined
- Jun 8, 2021
- Messages
- 5,465
- Solutions
- 1
- Reaction score
- 10,469
- Points
- 113
They're not bullsh!tting at all...if they don't bother to look it up.So essentially, dealers are bullsh!tting us, when they say "they don't know"
2021 Ram Rebel
2016 Dodge Charger scat pack
2021 Jeep Wrangler Unlimited Sahara
arod412
Ram Guru
Haha... I love the answer of " it's on its way". I'm like " can you be more specific"They're not bullsh!tting at all...if they don't bother to look it up.
2021 Ram Rebel
2016 Dodge Charger scat pack
2021 Jeep Wrangler Unlimited Sahara
- Joined
- Jun 8, 2021
- Messages
- 5,465
- Solutions
- 1
- Reaction score
- 10,469
- Points
- 113
It's on it's way - "to the dealership"Haha... I love the answer of " it's on its way". I'm like " can you be more specific"
2021 Ram Rebel
2016 Dodge Charger scat pack
2021 Jeep Wrangler Unlimited Sahara
Usmc041127
Active Member
- Joined
- Sep 11, 2021
- Messages
- 101
- Reaction score
- 104
- Points
- 43
- Age
- 44
As normal I am in the screwed group.
I'm putting the chart in here again, so you don't have to look back to cross-reference.
Long story short, you see where your dot is on the order timeline. In a perfect world, you would trace to the right and expect your truck to be built where that horizontal line touches the thin blue line (late February in your case). But as you can see, RAM is building trucks all over the spectrum. People who ordered in May are just getting trucks build (e.g., kev21) while other people who ordered in October (and even November) are also getting trucks built.
- The squiggly line on the left represents the timeline of actual orders (VIN assignments). Ordering opened on 5/6/21 and VINs started at 100001. That's the bottom left of the chart. As time has gone by (X axis) the VINs have gone up (Y axis).
- The thin blue line in the middle represents the "theoretical" date that your truck should have been built, based on the assumptions listed (9/13 start of production, 6000 trucks/week), and also assumes that everything is built sequentially by VIN. Obviously, those are huge assumptions, but it was a starting point.
- The thick blue band represents the theoretical delivery date (3-4 weeks after the theoretical build sheet date).
- All of the dots represent "actual" build dates for each VIN.
If your dot ends up being to the left of the thin blue line, then you're fortunate (or bribed Ram, as @monkeypunch so eloquently said).
If your dot ends up being to the right of the thin blue line, then you're getting "screwed".
View attachment 113847
Mathis35
Active Member
- Joined
- Apr 25, 2021
- Messages
- 172
- Reaction score
- 185
- Points
- 43
- Age
- 35
*Bigdodge places order number 4*Why does it say "vehicle damaged" in there?
Users who are viewing this thread
Total: 1 (members: 0, guests: 1)
